


产品搜索

图像质量分析软件IQ-Analyzer X
摘要:图像质量分析软件IQ-Analyzer X是一款专业的图像分析软件。主要是用于各类camera的图像质量分析。可以用于分析图像的MTF分辨率、畸变、颜色还原性、动态范围、周边光亮、灰度等级等等摄像头各项参数进行客观分析,可以有效的分析摄像头的参数性能进行完整评价。
图像质量分析软件IQ-Analyzer X是一款专业的图像分析软件。主要是用于各类camera的图像质量分析。可以用于分析图像的MTF分辨率、畸变、颜色还原性、动态范围、周边光亮、灰度等级等等摄像头各项参数进行客观分析,可以有效的分析摄像头的参数性能进行完整评价。
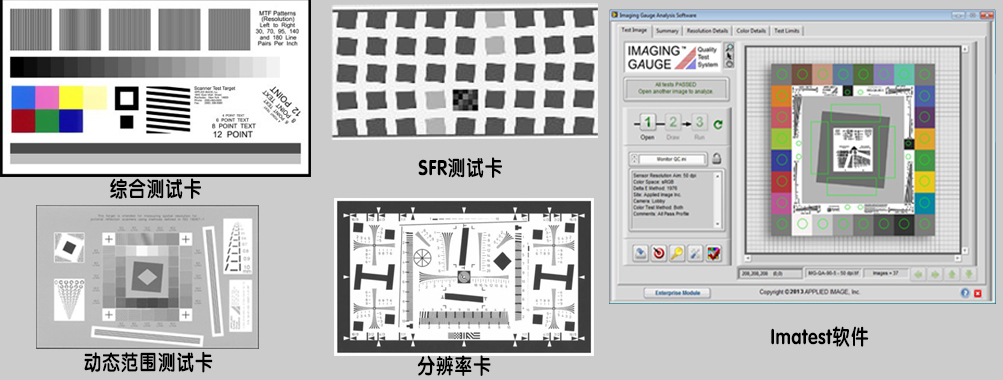
图像质量分析软件IQ-Analyzer X 专业影像分析软件,符合ISO标准,可以对客观测试进行分析,包括分辨率测试,畸变测试,色彩测试,均匀性测试,动态范围,畸变等等测试项目,可以配合测试图卡进行对应的分析。
推荐采用德国Image- Engineering 公司的测试分析软件IQ-ANALYZER X进行分析,其软件在国内外各大公司都有采用,配合其高质量的测试图卡,可以很好的对图像进行准确的分析,增强了测试的准确定和精度。
图像质量分析软件IQ-Analyzer X 测试的各项具体参数:
| Module | Features |
| OECF | • Support of various grey scale targets including TE240, TE241, TE259, TE264, etc. |
| • Determination of OECF according to ISO 14524 (camera OECF) | |
| • Calculation of ISO Speed values (sat, 10, and 40) based on ISO 12232 | |
| • Determination of fixed pattern noise, total noise, and temporal noise based on ISO 15739 | |
| • Visual noise analysis based on ISO 15739 (including L*, u*, v* components) | |
| • Dynamic range determination based on ISO 15739 (f-stops, densities) | |
| • Output range calculation (Digital values) | |
| • White balance accuracy by calculation the distances for R, G, and B curves | |
| • LCH based analysis on greyscale | |
| • Waveform style analysis | |
| COLOR | • Support of various charts like x-rite color checker, color checker SG, Color checker DC, IT8, TE188, TE226, and TE106 |
| • Selectable color spaces for source images | |
| • Whitepoint and white point adaptation settings | |
| • Delta E analysis including colored encoding of results | |
| • Comparison window reference values to sample | |
| • Comparison of two cameras by making one camera the reference | |
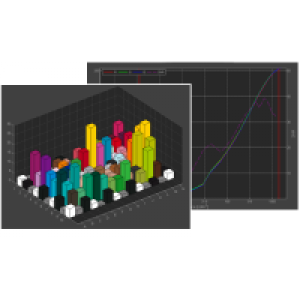
| • Delta E 3D bar diagram according CIE 15 | |
| • Yxy diagram | |
| • Lab diagram CIE 15 | |
| RESOLUTION | • Support of charts like TE253, TE265, TE261, TE42, QA62 |
| • SFR measurement based on slanted edges according to ISO 12233 | |
| • MTF measurement based on sinusoidal Siemens stars according to ISO 12233 (revision) | |
| • SFR measurements based on bitonal (black and white) Siemens stars | |
| • Power spectrum measurement based on dead leaves target | |
| • Power spectrum measurement based on white noise target | |
| • Kurtosis measurement based on white noise target | |
| • Shading correction for SFR and MTF measurements | |
| • Distortion correction for slanted edge measurement with polynominal fit of line spread function | |
| • Distortion correction for MTF measurement with Siemens star by border detection | |
| • Edge profile for slanted edge analysis | |
| • Frequency values for selectable modulation threshold values including limiting resolution at 10% Modulation | |
| • Automatic Nyquist frequency detection and implementation in graphical results | |
| • Integration of area below the MTF/SFR curve with and without contrast sensitivity of the human eye (viewing conditions) in percent of the ideal MTF (1 until Nyquist then 0). | |
| • Division of stars into sectors and separate analysis for visualization of orientation specific image processing | |
| • Each star can be analyzed separately | |
| • Stars can be grouped into image heights | |
| • Various options for linearization of the images | |
| • Overview graph for quick check of overall performance (esp. centering) for Siemens star charts | |
| • Analysis of luminance channel or each color channel separately including analysis of colored targets | |
| DISTORTON | • Support of various targets like TE174, TE183, TE 251, TE260 |
| • Determination of TV distortion (EBU) | |
| • SMIA distortion analysis | |
| • LGD (lens geometric distortion) analysis according to CPIQ | |
| • Representation in several graphs like grid, 2D contour, and quiver plot | |
| • Polynomial fit as input for automatic compensation | |
| • Lateral chromatic aberration as distances for cross or dot location in color channels (G-B, G-R) | |
| • Indicator for longitudinal chromatic aberration | |
| • Robust automatic detection of crosses or dots | |
| • Semi automatic detection mode for highly distorted images | |
| HISTOGRAM | • Dead / defect pixel determination based on white, grey or black image |
| • Selectable tonal range for outliers | |
| • Calculated tonal range based on sigma selection | |
| • Linear and logarithmic histogram visualization | |
| • Numeric results for outliers in pixels and clusters | |
| • Pixel map for defect pixels | |
| SHADING | • Support of various targets like TE42, TE255 and all targets with uniform patches at several locations |
| • Support of OECF for linearization | |
| • Graphical results in 3D, contour and linear plots | |
| • Polynomial fit for compensation algorithms | |
| • Results in f-stops, L* values, Y values | |
| • Color shading analysis based on digital numbers G-B, G-R | |
| • Color shading based on chroma C*a,b value according to CIE 15 | |
| • Color shading based on Delta E_ab according to CIE 15 | |
| • Visual noise evaluation (to visualize in camera shading compensation) according to ISO 15739 | |
| • Signal to noise evaluation in dB | |
| 42 | With one single chart (TE42 'Forty Two') OECF (Opto Electronic Conversion Function), dynamic range, resolution, shading, distortion, lateral chromatic aberration, color reproduction, and kurtosis parameters can be measured and analysed according to ISO standards. |
需要了解更多信息请来信咨询:
姜先生 Plum
Tel: 18620350396
Email:plum.jiang@dghcgx.com
